U.S. Wealth by Generation
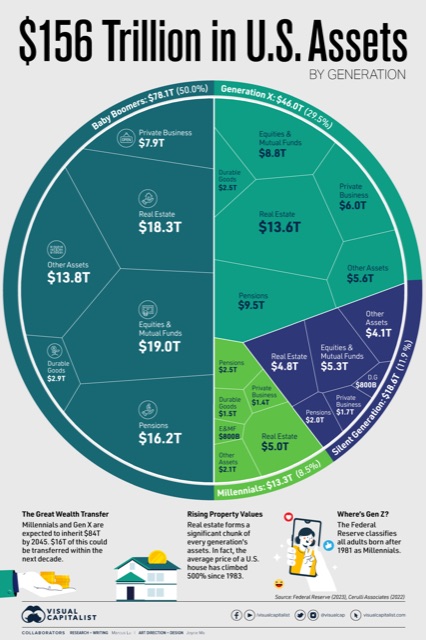
Finally, we subtract liabilities from assets to arrive at total wealth by generation in the United States. Figures again are USD and in trillions.
| Generation | Assets | Liabilities | Wealth | Share of Wealth |
|---|---|---|---|---|
| Silent Generation | $18.6 | $0.8 | $17.8 | 13% |
| Baby Boomers | $78.1 | $5.1 | $73.0 | 53% |
| Generation X | $46.0 | $7.0 | $39.0 | 28% |
| Millennials | $13.3 | $5.5 | $7.8 | 6% |
| Totals | $156.0 | $18.4 | $137.6 | 100% |
https://www.visualcapitalist.com/us-wealth-by-generation/
Each generation is shaped by its own unique historical context and cultural experiences, creating a shared perspective about the world that is different from their elders.
Therefore, its shouldn’t surprise us when any given generation takes the opportunity to shape the society around them, bending both political and economic structures to align with their values.
In the inaugural edition of our Generational Power Index (GPI), we aim to accurately break down the landscape of generational power in the current moment.
Links
Topic