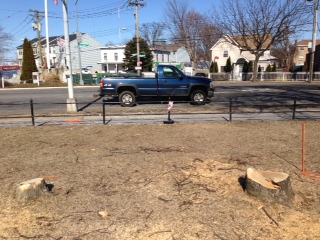
As preparations continue for the replacement of the old City Island Bridge and the construction of a new bridge, City Island Images found several trees have now been cut down along the park after a traffic signal was installed in same area and there are now plans to "temporarily" remove the military memorial island there.
City Island Images went to the American legion to inquire. Fred Ramftl, who works as a bartender there told us that the post commander was not available, but since Ramftl also serves as City Island Civic Association Vice President, he assured us he is well aware of DOT's plans to "temporarily" remove the memorial island located near the top of the bridge, adding that the construction project has stopped.
If this is truly the case, why were the trees cut down? Why has New York City Department of Transportation approved the installation of a traffic light in the area? Why is NYC DOT planning to close the bike and pedestrian path on the south side of the City Island Bridge to move the existing water main on the bridge?
We suggest that anyone who's interested in learning the real truth may write to press local civic leaders. city.island.civic@mac.com


